The Hidden Variable in Every Deal
Every realtor serving investor clients knows the feeling of presenting a pro-forma that looks perfect on paper, only to have the deal stall because the investor's own spreadsheet tells a different story. The culprit is almost always the expense projection. When we rely on generalized industry rules of thumb—like the classic 50% expense ratio—we ignore the reality that operating costs vary wildly even between adjacent city blocks.
For the modern agent, the ability to differentiate your service lies in precision. By adopting micro-market rental expense ratio analysis for realtors, you move from being a facilitator of transactions to a strategic advisor who understands the true, localized cost of doing business. This analytical rigor is exactly what high-volume investors look for when choosing their go-to partner.
The Fallacy of Global Expense Ratios
The industry-standard rule of thumb suggests that landlords should expect expenses to consume 45% to 50% of their gross income. While this might serve as a rough back-of-the-napkin heuristic for a broad national average, it is dangerously inaccurate when applied to specific neighborhoods. A property in a high-tax, older-infrastructure district will have drastically different maintenance and tax burdens than a new-build development two miles away.
Applying a one-size-fits-all ratio often leads to inflated or deflated cash flow projections. If your client buys based on an optimistic ratio that ignores high local property tax rates or specialized insurance requirements for certain flood zones, they may experience "investor remorse" once the first year's actuals roll in. As a professional, your goal is to calibrate these assumptions using granular, location-specific data. For those looking to refine their broader approach to client success, using FMR data to calibrate investor rental pricing is a foundational skill that pairs perfectly with expense-ratio analysis.
Why Granular Benchmarking Protects Your Professional Reputation
Your value as an investor-focused realtor is tied to the performance of the assets you help acquire. When an investor loses money because a deal was modeled on inaccurate expense assumptions, your credibility suffers. By integrating localized expense benchmarking, you create a "safety buffer" of data that accounts for the reality of micro-markets, including variance in property management fees, utility costs, and local tax levies.
Investors who see you using data to stress-test their potential acquisitions view you as a partner, not a salesperson. They know you have done the homework. This level of diligence provides the framework needed to justify purchase prices and manage expectations, which is vital in volatile markets. If you want to dive deeper into the technical side of property validation, check out predictive vacancy rate modeling for real estate investors to ensure your model is robust from every angle.
Establishing Your Micro-Market Baseline
To begin, you need to collect representative expense data for specific sub-markets. Start by identifying the average tax millage rates, typical insurance premiums for the area, and localized maintenance costs common to the building ages in that neighborhood.
- Property Taxes: Identify the specific tax district. Do not guess based on the previous owner's taxes, as these are often reassessed upon sale.
- Insurance: Obtain quotes for investor-specific landlord policies, accounting for local risks like weather-related damage.
- Maintenance & Capex: Use historical data from similar properties to estimate annual repairs rather than using a flat percentage of rent.
By building this data set, you can create a neighborhood-specific expense profile. This allows you to say to your client, "While the market average for expenses is 45%, this specific pocket tends to run closer to 52% due to local infrastructure taxes and higher utility requirements."
Integrating Data-Driven Insights Into Your Workflow
Build Your Investor Deal Pipeline with better, data-backed insights using Rental Prop Finder.
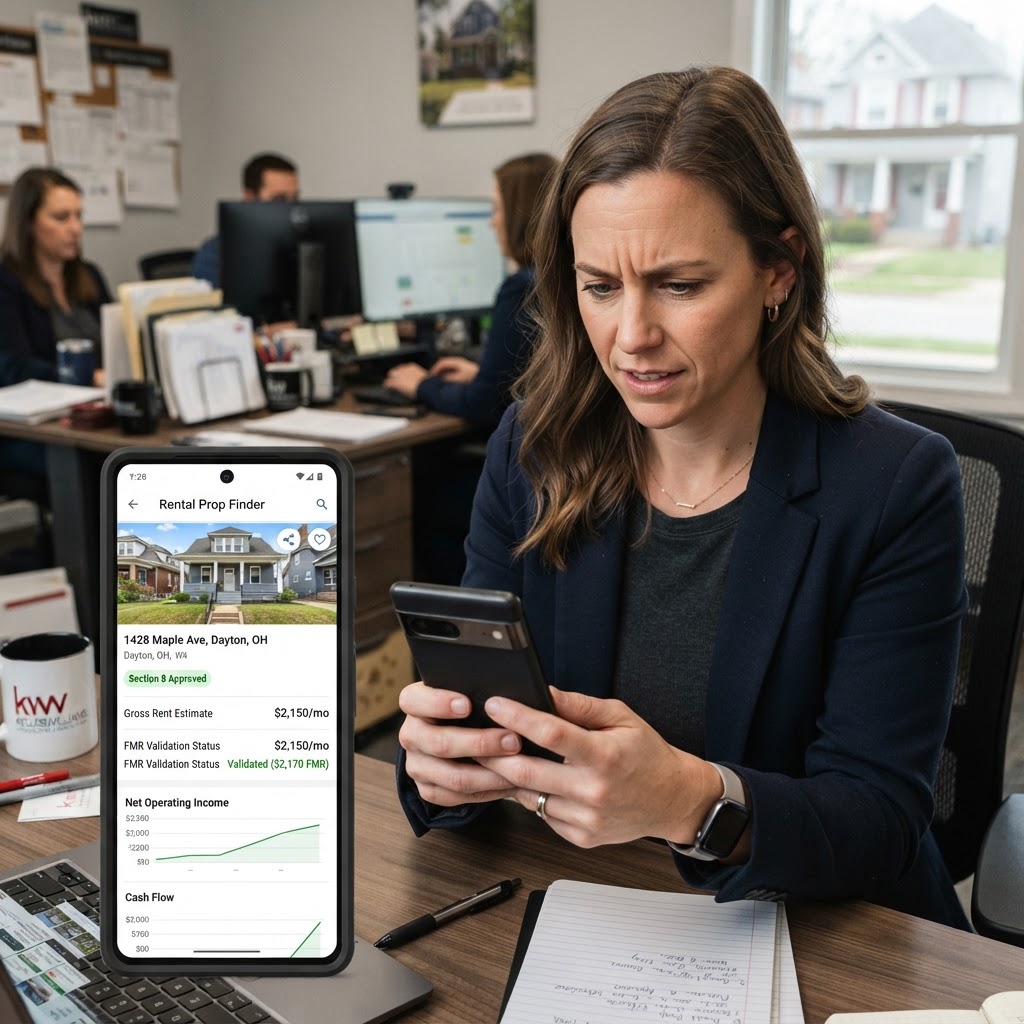
Once you have established your local benchmarks, the next step is applying them to individual listings. Rental Prop Finder helps evaluate properties by providing tools that streamline the comparison process, allowing you to plug in these custom, verified expense ratios rather than relying on generic estimates.
By using a tool that automates the heavy lifting of NOI and DSCR calculations, you can quickly swap in your researched expense ratios to see the impact on cash flow in real-time. This dynamic approach enables you to show your investor exactly how a 5% difference in operating expenses changes their bottom-line return, moving the conversation from "gut feelings" to hard numbers.
Scaling Your Advisory Services
As you become known for your analytical approach, your business will naturally transition toward repeat clients. Investors don't just want a deal; they want a partner who provides ongoing value through precise forecasting. When you consistently demonstrate that you are looking at the micro-market, you differentiate yourself from agents who are merely looking at the listing price.
Ultimately, the goal is to make the acquisition process transparent. When an investor trusts your numbers, the closing process becomes faster and less fraught with hesitation. By focusing on localized expense analysis, you ensure that you aren't just finding properties—you are finding viable investments that meet your clients' financial objectives.
Final Recommendation
Start by auditing your last five deals. Calculate the actual expense ratios you observed versus what you initially projected. Use these findings to create a localized "Expense Map" for your primary target markets. Then, move to the next level by leveraging platforms like Rental Prop Finder to institutionalize this data, allowing you to present professional, data-rich analysis on every property you pitch to your clients.
Analyze a Property for Your Client
Important Disclaimer
Rental Prop Finder provides property and rental market data for informational and analytical purposes. Estimates and projections are not guarantees of rent, cash flow, financing, occupancy, or investment performance. Users should independently verify property details, expenses, local regulations, and financial assumptions before making an investment decision.